Introduction: Vibe Coding vs. Production Reality
Vibe coding with v0 is changing the way we build the web. The ability to generate complex, beautiful UIs in seconds simply by typing a prompt feels like absolute magic. But there is a hidden catch, as generating the UI is only half the battle.
While v0 is phenomenal for rapid UI generation, the raw output can sometimes be heavy or unoptimized for production if not handled correctly. If you take raw AI-generated code and push it straight to a live server without architectural refinement, you risk bloated DOM structures, unoptimized assets, and painfully slow load times.
In today's attention economy, we aren't fighting for minutes of user engagement, we are fighting for absolute milliseconds. A beautifully designed v0 component means absolutely nothing if it takes 5 seconds to render on a mobile device.
To put things into perspective, the average web page size in 2026 still hovers around a bloated 3MB, taking 2.5 seconds to load on desktop and a sluggish 8.6 seconds on mobile.
In stark contrast, the ultra-lean size of this exact v0-built website is just 586KB. It loads instantly.
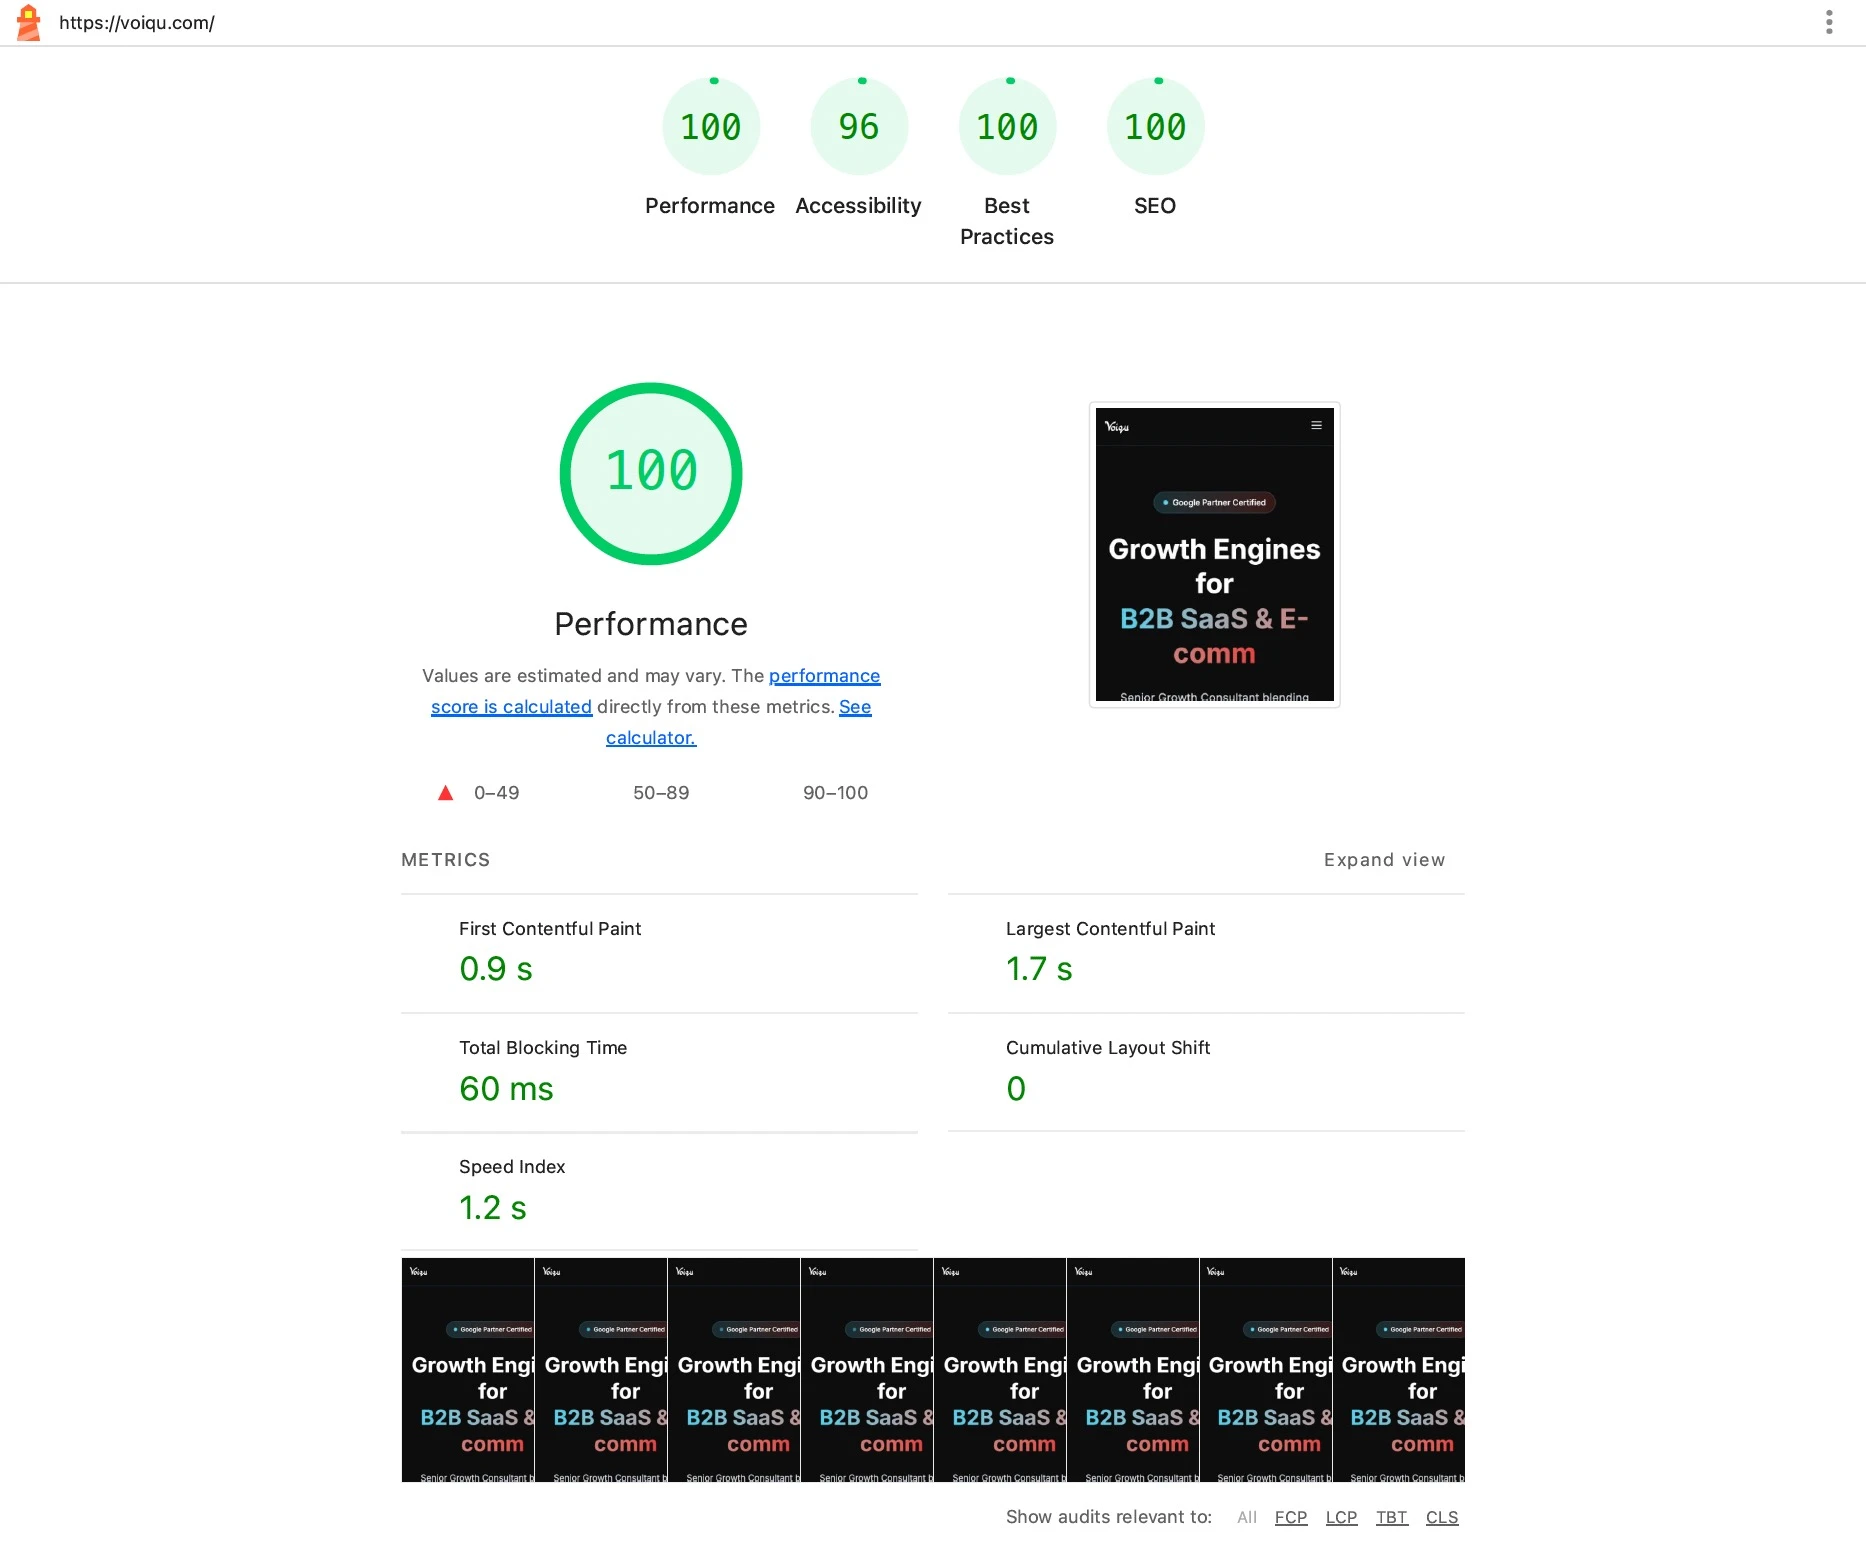
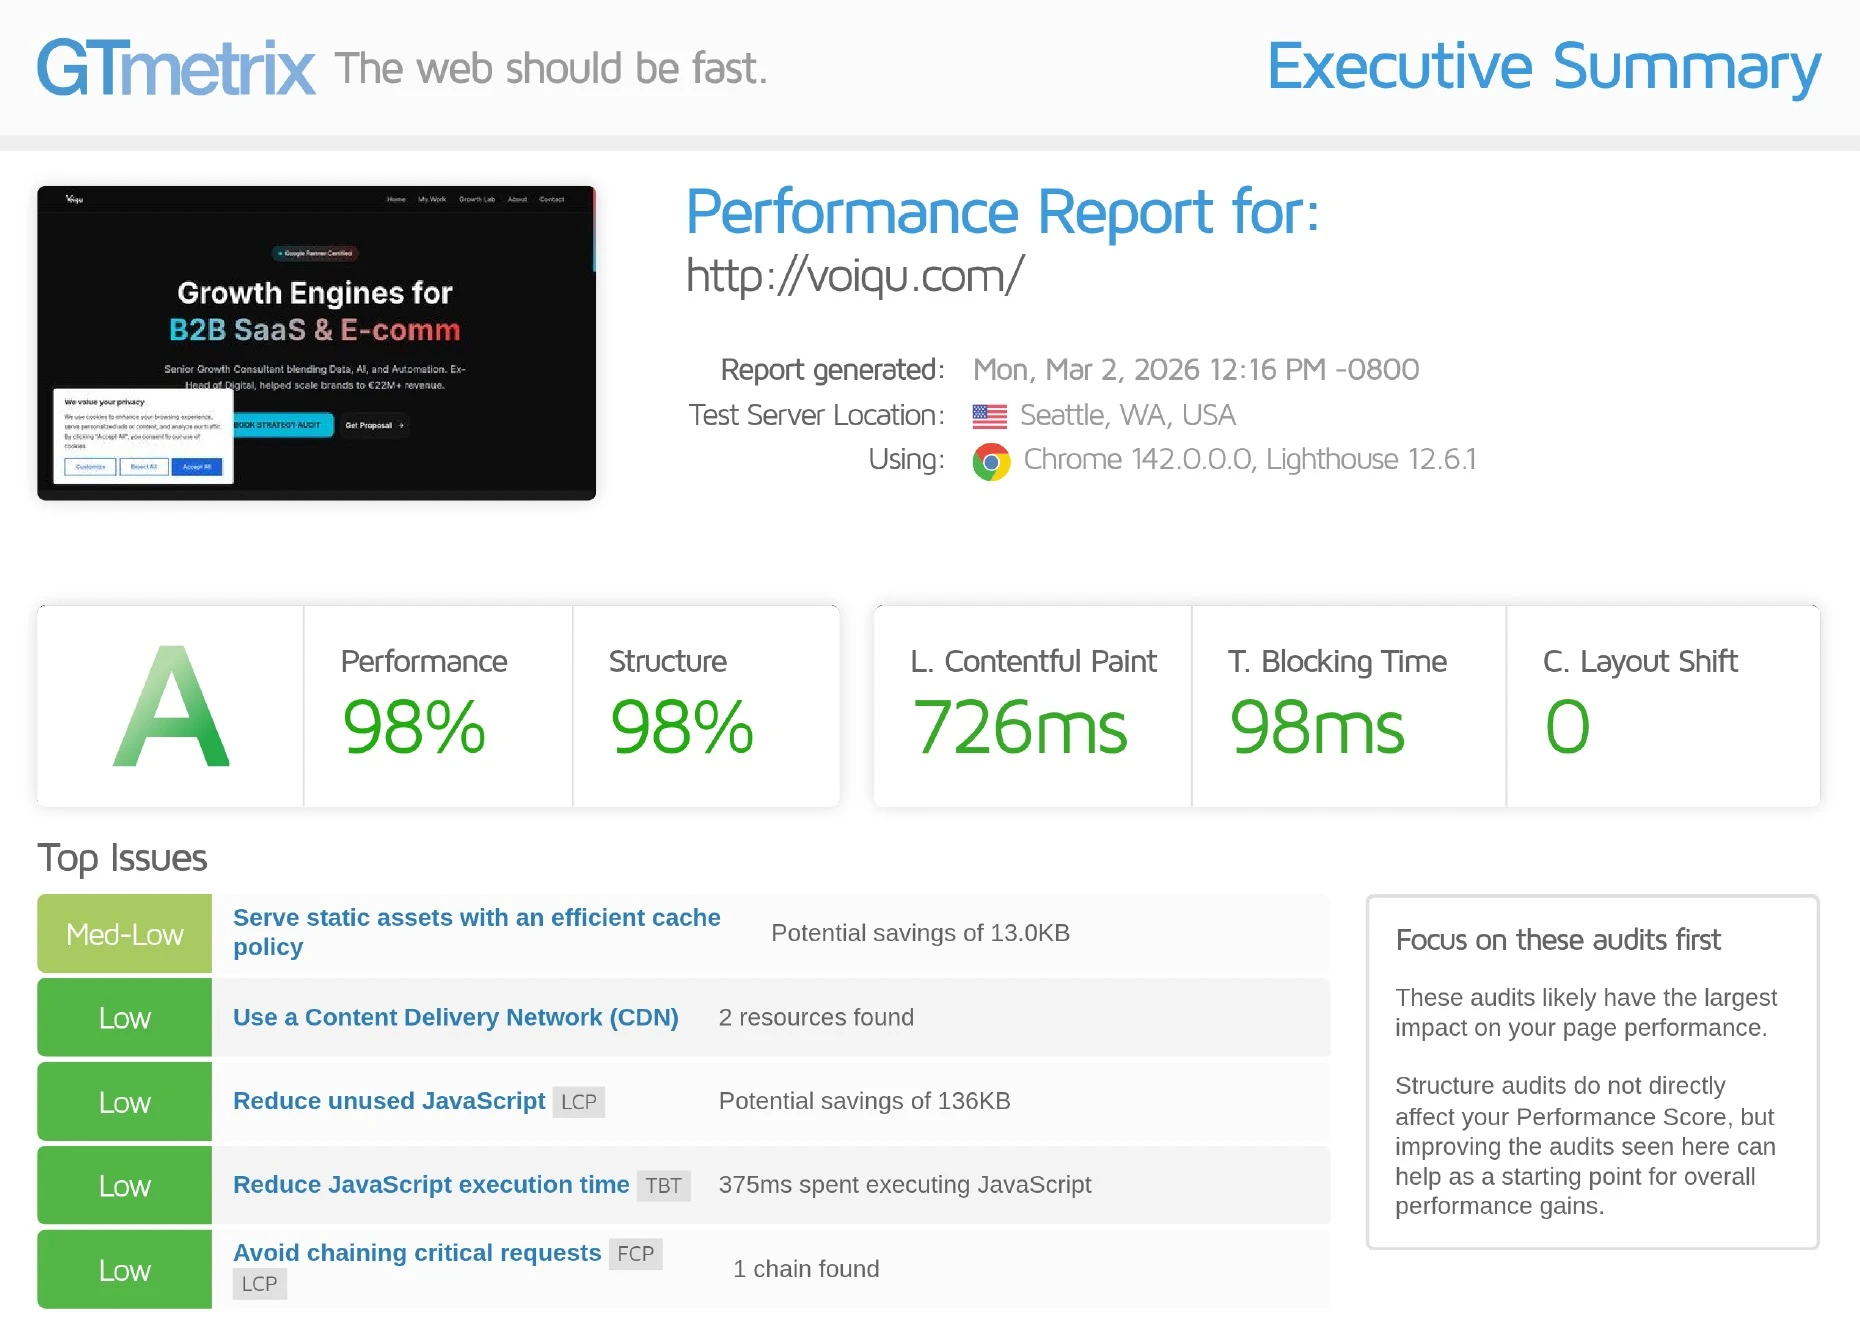
This guide is the ultimate playbook for taking a v0 export and making it production-ready. I will show you exactly how I transformed raw AI-generated code into a flawless 100/100 Google PageSpeed Performance score, with a First Contentful Paint (FCP) of just 0.9 seconds. Best of all, I achieved this completely for free.
The 20-Year Evolution: Escaping CMS Bloat
I have been building websites for 20 years. To give you an idea of how much the landscape has changed, my very first website was built using Adobe GoLive. Back then, web design was practically the dark ages. We built incredibly simple, static HTML sites. While they lacked dynamic features, they had one accidental advantage, they were inherently fast because there was hardly anything for the server to process.
As the web matured, we demanded more functionality. We moved away from static files and embraced Content Management Systems (CMS) like WordPress. Suddenly, we had visual builders, endless plugins, and massive, heavy themes.
But this convenience came at a massive cost to performance. Traditional dynamic websites require server-side languages (like PHP) and heavy database queries (like MySQL) just to figure out what to show the user. My own legacy site fell victim to this exact bloat, becoming sluggish and frustrating to maintain.
The Dark Side of AI Code Generation
Let's be honest about how AI code generators work. Tools like v0 are trained to give you visually perfect results as fast as possible. To achieve complex layouts quickly, the AI often relies on deep nesting, wrapping elements in five layers of flexbox or grid container divs just to center a button.
In small doses, this is fine. But when you build an entire landing page this way, you end up with an Excessive DOM Size. A massive Document Object Model means the browser has to spend an enormous amount of CPU power parsing the HTML, calculating CSS rules, and rendering the layout. On a high-end MacBook, you won't notice it. On a three-year-old mid-range smartphone, the main thread will lock up completely, causing a terrible interaction delay.
The 100/100 Modern Tech Stack
Instead of trying to patch up a bloated CMS, I decided to leverage the AI revolution properly. Here is the exact modern tech stack I used to bypass heavy server-side processing and fix AI DOM bloat:
- ✦
v0 by Vercel: For rapid, Blade Runner-inspired UI generation and React component structuring.
- ✦
Google Antigravity: Used as an engineering copilot for deep code refinement. I prompted Antigravity specifically to flatten the DOM tree and remove redundant Tailwind utility wrappers from the v0 output.
- ✦
Next.js App Router: The React framework that allows for aggressive server-side rendering (SSR) and static site generation (SSG), making AI output SEO-friendly.
- ✦
GitHub: For seamless version control and automated CI/CD pipelines.
- ✦
Netlify: For blazing-fast edge deployment, delivering static assets globally without database queries, entirely for free.
The ROI of Speed: Why Milliseconds Matter
A fast website isn't just a technical vanity metric, it is the foundation of your online revenue. The data proves that a slow website is actively burning your marketing budget and driving users straight to your competitors.
- The Bounce Rate Reality: As your page load time increases from 1 second to 3 seconds, the probability of a bounce increases by a massive 32%. If your load time slips to 5 seconds, that probability shoots up by 90%, and at a 10-second load time, you are looking at an astonishing 123% increase.
- B2B & B2C Conversions: For B2B companies, a site that loads in 1 second experiences a conversion rate 3 times higher than a site that takes 5 seconds.
- Mobile Attrition: For every single second of delay in mobile page load, your conversions can go down by up to 20%.
The biggest players on the internet have quantified exactly how much a second is worth. The BBC revealed they lose an additional 10% of their users for every single second their pages take to load. Amazon historically found that just 100 milliseconds of extra load time cost them 1% in total revenue.
The Core Web Vitals (The Metrics That Matter)
For years, website owners fixated on fully loaded time. But Google doesn't care about that, they care about perceived performance. To win at SEO and user experience in 2026, these are the exact official metrics you need to obsess over:
- Largest Contentful Paint (LCP): Measuring perceived load speed. How fast does your hero image or main text appear? Keep it strictly under 2.5 seconds.
- Interaction to Next Paint (INP): Measuring responsiveness. When a user clicks a button on your v0 generated component, does it react instantly, or is the main thread blocked by heavy JavaScript?
- Cumulative Layout Shift (CLS): Measuring visual stability. Keep it to a flat 0.1 or less to ensure elements don't jump around and cause accidental clicks.
- Time to First Byte (TTFB): The initial handshake. Ensure your server responds to the browser's request instantly.
The Playbook: Making v0 Code Production-Ready
Achieving a 100/100 score means relentlessly hunting down bottlenecks. Here is the step-by-step optimization playbook to refine your AI-generated code:
1. Advanced Image Optimization & Next/Image
AI won't optimize your assets for you. Unoptimized images are the largest drain on bandwidth. Because v0 outputs React, you should never use standard HTML <img> tags.
- Always use the
next/image component. This automatically converts images to WebP or AVIF formats, prevents layout shift by enforcing width and height attributes, and automatically lazy-loads images below the fold. - The LCP Hack: For your Largest Contentful Paint (LCP) element, usually your hero image, you must bypass lazy loading. Add the
priority attribute to the next/image tag to force the browser to load it immediately. On this site, my total image payload is merely 149KB because of this strict architecture.
2. Minify, Clean, and Manage the DOM
As mentioned, AI can write a lot of code, sometimes generating excessive div wrappers.
- Strip out any unused CSS utility classes and strictly minify JavaScript payloads before deployment.
- Content Visibility: Implement
content-visibility: auto in your CSS for massive off-screen sections (like long blog content). This tells the browser to completely skip calculating their styles and layouts until the user scrolls near them, dramatically speeding up initial rendering.
3. Font Optimization (Next/Font)
Don't download entire font families from external servers like Google Fonts if you only use two weights. External font requests create render-blocking network hops.
- Use
next/font to automatically host your fonts locally at build time. - It serves lightweight, subsetted
WOFF2 files containing only the characters you actually use, and inherently utilizes font-display: swap to instantly display fallback text while the custom font loads in the background, preventing invisible text flashes.
4. Lazy Loading Components with next/dynamic
Not every single component generated by v0 needs to be loaded immediately. If you have a heavy interactive chart, a modal, or a complex footer, don't ship that JavaScript in the initial payload.
- Use
next/dynamic to lazily load React components only when they are needed or when they scroll into the viewport. This keeps your First Load JS size incredibly small.
5. Moving Scripts off the Main Thread
Analytics trackers, chat widgets, and cookie banners often block the main thread and ruin your Interaction to Next Paint (INP) score.
- You must defer these asynchronous scripts. For advanced optimization, look into libraries like Partytown, which actually move resource-intensive third-party scripts into a Web Worker, freeing up your main thread entirely so your site remains butter-smooth even while firing tracking events.
6. Leverage Edge CDNs
The physical distance between your server and your user creates latency.
- Deploy on fast, serverless Edge networks like Netlify or Vercel so static files are distributed globally via CDN.
- Utilize the Speculation Rules API. This modern JSON syntax allows you to define exactly which URLs the browser should dynamically prefetch in the background based on user intent (like hovering over a link), making subsequent page loads instantaneous.
Prompting for Performance
The absolute best way to optimize AI code is to ask for it upfront. When using v0 or Google Antigravity, don't just ask for a cool pricing section.
"Build a pricing section using semantic HTML and minimal div nesting. Use Tailwind grid instead of nested flexboxes. Ensure it is fully responsive without relying on heavy JavaScript state."
Engineering your prompts for performance saves hours of manual refactoring later.
Conclusion: The Final 20%
Speed is no longer optional. It is the foundation of digital success. In 2026, a fast website isn't just about scoring a 100 on an arbitrary test, it is about respecting your users' time and building a competitive advantage that directly translates to increased revenue.
Vibe coding gets you 80% of the way there in seconds. The final 20%, the architectural refinement, the component lazy loading, the image compression, and the strict performance tuning, is what separates a hobby project from a production-grade enterprise application.
By abandoning legacy CMS bloat and following this optimization playbook, you can leverage the immense speed of AI generation without ever sacrificing the performance your users (and Google) demand.